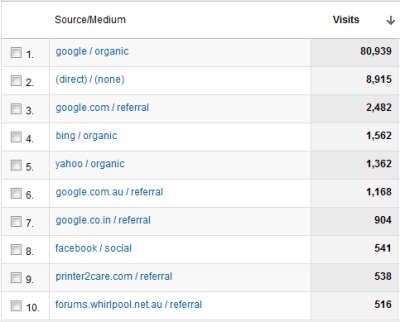
In keeping with my annual review of things and following on from my 2010 website traffic statistics, below is a quick summary of what happened during 2011.
Throughout 2010 my blog took 97,509 visits and 132,068 pageviews and for the year of 2011 108,325 visits and 140,882 pageviews. It is nice to see that my sites visitation has grown over the year, however it is a long way from the hay days of 145,000 visits when I was writing technical style posts and a mixing it with pop culture items like Australian Idol.
Breaking down the traffic sources for the year, shows a 4% increase in search engine traffic as a percentage of the whole site, up from 74% to 78%. Within the search engine space, Google continues to completely dominate, increasing by 2% to just under 96%. Despite every effort made by Microsoft, such as buying the search engine business from Yahoo! in an attempt to gain market share – it isn’t reflected in the traffic for my blog and collectively Bing & Yahoo! represent about 3.5% of my search referrals.
The most popular posts for the year were nearly identical to the past years, with the a cute Ragdoll cat photo edging its way into the list:
- Disable Options In A Select Dropdown Element
- Select Option Disabled & The JavaScript Solution
- Oracle RETURNING Clause
- Like Father, Like Daughter
- ORA-04030: out of process memory when trying to allocate <x> bytes
Ignoring posts I’d written in a previous years and isolating only 2011, a different picture arises:
- How To Kill Paper Wasps
- Windows 7 HP Laserjet Driver Support
- Best Men’s Razor
- Evie’s 1st Birthday Ladybug Themed Party
- Canon 600D Digital Camera
Bring on 2012, with a bit of luck the landscape will have changed by then again.


They say experts can interpret & write statistics to say anything they want!
I reckon you must be a first class expert by now!
Keep it up.
I also hear that 9 out of 10 reported statistics are incorrect, so never trust them.