At the end of 2008, I mentioned that I was going to publish some of this sites web statistics. It took a little longer to find the energy and time to put it together and without further ado, my web statistics for 2006.
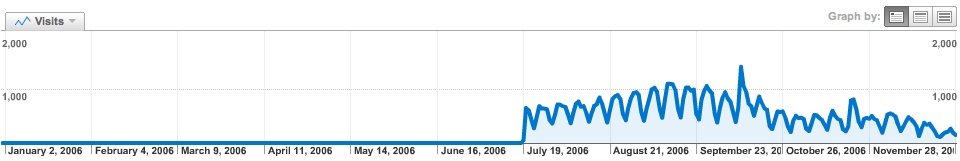
I only installed Google Analytics on the site half way through July 2006. I was happy to see my traffic going up at that point, until I found out the hard way that being popular online has a cost associated to it. Over the roughly half year reporting period, 95010 visitors came to the site which resulted in 139687 pageviews.
The breakdown of the different traffic sources to the site over that window paints quite a scary picture of the search engine competitiveness, even back in 2006:
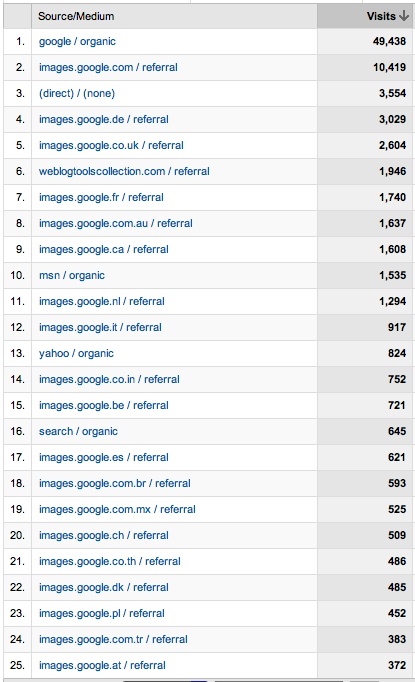
As you can see, the first non-Google search engine comes in at position 11 and they are delivering about 3% of the traffic of Google web search. If I include all Google sources, such as Google Image Search – the Google network of sites is providing a whopping 89% of all traffic to the site.
The most popular posts for the year were:
- Select Option Disabled & The JavaScript Solution
- Disable Options In A Select Dropdown Element
- Tinfoil Computer
- ASP Error ‘ASP 0104: 80004005?
- The Uplate Game Show With Hotdogs
No idea Al. What do our site stats look like.
I wonder if the new WP SEO add-in has made any difference ?